
Categories
Overview
MyLens is an AI visualization platform that turns dense documents, webpages, videos, and spreadsheets into interactive diagrams users can explore instead of reading long walls of text. It targets analysts, educators, consultants, and product teams who need to extract structure from complex sources and communicate findings through timelines, mind maps, quadrants, and other dynamic visuals. Every insight can be traced back to the original source for verification.
How Dynamic Visualizations Work
Users add raw or unstructured inputs such as PDFs, Word files, PowerPoint decks, long text, webpages, YouTube links, images, and CSV or Excel data. MyLens analyzes the material and generates visual storyboards that highlight key relationships, themes, and sequences. Unlike static charts, the visuals remain interactive: users can click to expand sections, drill into details, or request citations that link conclusions to the underlying source passages.
Key Capabilities
- Multi-source ingestion: Combine several inputs into one explorable visualization when plans allow multiple sources per storyboard.
- Interactive exploration: Expand, drill down, and ask follow-up questions inside the visual canvas.
- Source-linked citations: Keep conclusions auditable by tracing insights back to original documents or pages.
- Customization and export: Adjust colors, fonts, and layouts, then download, share, or embed results.
- Chrome extension: Convert live webpages, dashboards, news articles, and YouTube pages into visuals from the browser.
Use Cases
- Research synthesis: Turn long reports or article collections into navigable summaries.
- Teaching and training: Build explorable study aids from textbooks, slides, or lecture transcripts.
- Product and strategy reviews: Map customer feedback, market notes, and spreadsheet metrics into one view.
- Meeting preparation: Convert dense pre-read packets into visual briefs teams can scan quickly.
Privacy Positioning
MyLens states it does not use customer data to train its AI models and does not share user data with third parties. For teams handling confidential research or client materials, that privacy stance is a core part of the product promise and should still be validated against current terms before uploading regulated content.
Plans and Pricing
Public pricing includes a Free plan at $0 with 15 AI credits per month, a 1K source limit, and one source per storyboard. Pro costs $12 per month per member billed yearly at $144 per member, adding 150 monthly credits, a 10K source limit, multi-source storyboards, and manual editing. Premium costs $24 per month per member billed yearly at $288 per member, with 450 monthly credits, a 30K source limit, powerful AI mode, brand kit, and priority support. Business costs $120 per month per member billed yearly at $1,440 per member, with 2,000 monthly credits, a 100K source limit, deep web search, and customer success support.
Input Types and Starting Points
MyLens provides dedicated entry points for PDFs, long text, Word and PowerPoint files, webpages, YouTube videos, screenshots, and spreadsheet data. Those paths reduce setup friction because users do not have to normalize every source into one format before visualization begins. Free users can experiment with limited monthly credits and a single source per storyboard, while paid tiers unlock larger source limits, more credits, multi-source projects, manual editing, and brand styling for recurring client deliverables.
Education and Team Communication
MyLens is frequently used to convert long reading assignments, lecture materials, and internal research packets into visuals students or stakeholders can explore non-linearly. Teachers can personalize fonts and colors before sharing, while consultants can export diagrams for client presentations without rebuilding charts manually in slide tools. The Chrome extension extends that value to live webpages, which is useful when the source material changes frequently and re-uploading files would be impractical.
Limitations and Considerations
Credit limits and source caps mean heavy users must choose higher tiers or manage monthly usage carefully. Complex enterprise governance, role-based access, and offline workflows are not the primary focus of the public plans. Visual quality still depends on input clarity, so poorly structured source files may require cleanup before they produce useful diagrams.
Tool Overview
Pricing
Similar AI Tools
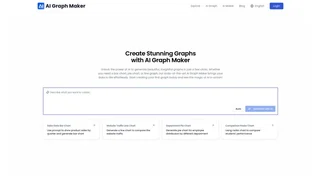
AI Graph Maker
AI Graph Maker is a free online tool that generates interactive charts, diagrams, mind maps, and data visualizations from text or data input using AI.

DALL·E 3
OpenAI's advanced text-to-image generation model with native ChatGPT integration, offering improved prompt adherence and creative control over DALL·E 2.

Poppy AI
Multiplayer AI workspace for analyzing videos, podcasts, PDFs, and voice notes to create viral content and brainstorm ideas collaboratively.
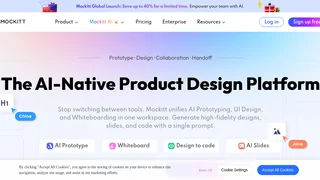
Mockitt
Mockitt is an AI-native all-in-one product design and prototyping platform by Wondershare that unifies prototyping, UI design, whiteboarding, diagramming, and AI slide generation in a single workspace.
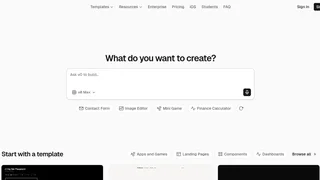
v0 by Vercel
AI-powered development platform that turns natural language prompts into production-ready, full-stack web applications with one-click deployment on Vercel.